Construction Marketing
This case study comprehensively analyzes the revenue and growth trajectory of a window and door installation company based in North Carolina, comparing the fiscal years 2019 and 2020.
The study examines key performance indicators, including the total number of leads, sales demos conducted, customer acquisition, and projects where payment was submitted. Despite significant challenges, the company demonstrated remarkable resilience and growth, driven by strategic adaptations and shifts in market demand. This report doesn’t reflect canceled or unavailable efforts due to the COVID-19 global pandemic.
Advertising 2019-2020
All lead sources account for 11 total records for the 2019-2020 year. In 2019-2020 the client trusted an agency to handle all their advertising, website development, and website maintenance.
| 2019-2020 Before Gaber |
|
|---|---|
| Lead: Any homeowner within the service area that needs home improvement and the resources to afford service. |
11 |
| Demo: A demo is when a sales representative visits a homeowner (lead) to present the service and secure a transaction. |
09 |
| Sold: A sold job is a contracted project that has previously been demoed. If the customer doesn’t qualify for financing, the lead is dead. |
02 |
| Netted: A project that has been contracted and the customer secured the financing needed to move forward. |
01 |
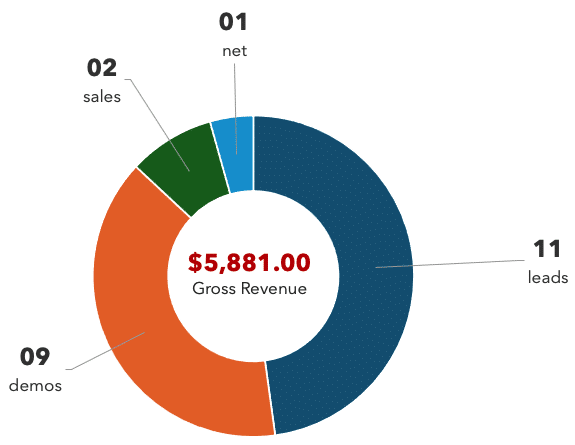
With a marketing investment of $20,000.00 and a return on investment (ROI) of $5,881.00, the client suffered a loss.
Advertising 2020-2021
The same sources accounted for 53 leads, 47 demoed, 18 sold, and 16 net. The client earned $170,814.00 from these lead sources in 2020-2021.
With better tracking, we broke down spending more accurately. This 800% increase is reflected only in the original lead sources tracked in the previous year.
| 2020-2021 After Gaber |
|
|---|---|
| Lead: Any homeowner within the service area that needs home improvement and the resources to afford service. |
53 |
| Demo: A demo is when a sales representative visits a homeowner (lead) to present the service and secure a transaction. |
47 |
| Sold: A sold job is a contracted project that has previously been demoed. If the customer doesn’t qualify for financing, the lead is dead. |
18 |
| Netted: A project that has been contracted and the customer secured the financing needed to move forward. |
16 |
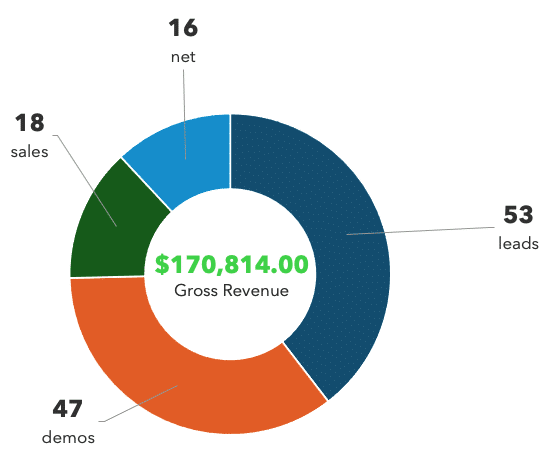
With a marketing investment of $68,059.02.00 and a return on investment (ROI) of $170,814.00, the client achieved a gain.
Gaber added new points of entry through four new lead sources. These new lead sources brought in an additional $200,121.00 in revenue.
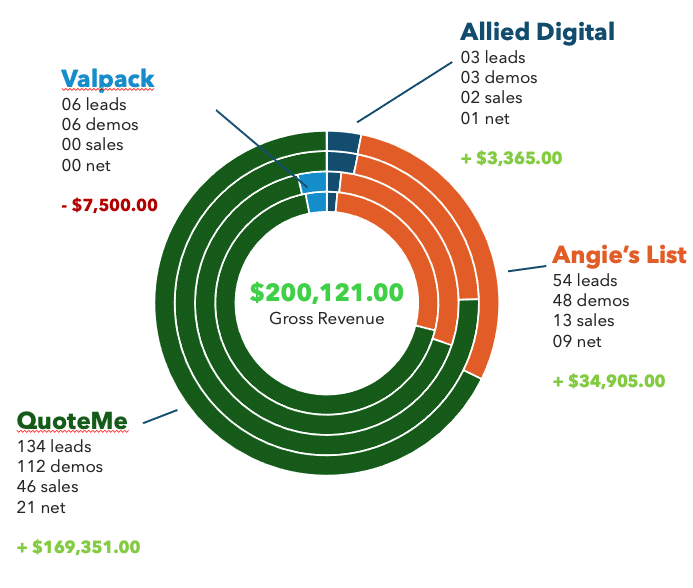
Based on the marketing strategy and the efforts thus far, our client has already increased revenue compared to the previous year by $306,766.53
The Call Center 2019-2020
In 2019-2020, cold calls accounted for most lead acquisition. It was also the highest investment at $21,600.00 / month. This investment doesn’t include bonuses issued against revenue earned.
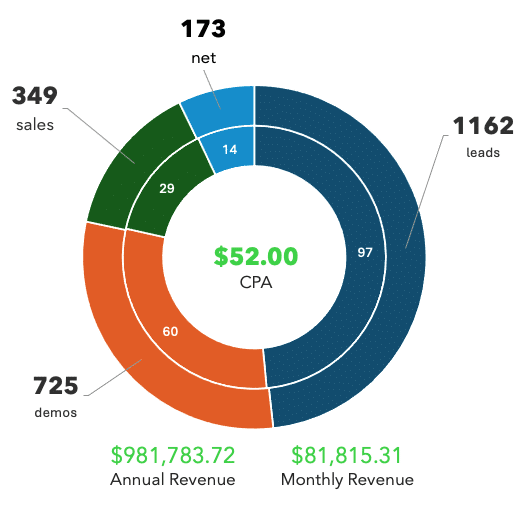
The company earned a revenue gain of $60,215.31/month with a $52.00 CPA.
The Call Center 2020-2021
In 2020-2021, we reduced the cost per acquisition (CPA). By reducing the number of agents needed by 50% and reducing the number of purchased lists by qualifying leads better, we cut expenses to $13,100.00/month.
Gaber reduced the CPA. As the campaign continued, the lower CPA and reduced expenses made for a better profit margin.
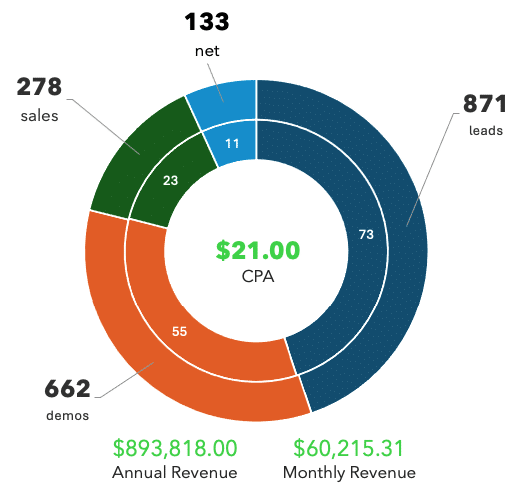
The client earned a revenue gain of $55,984.81/month with a $21.00 CPA.
Referrals
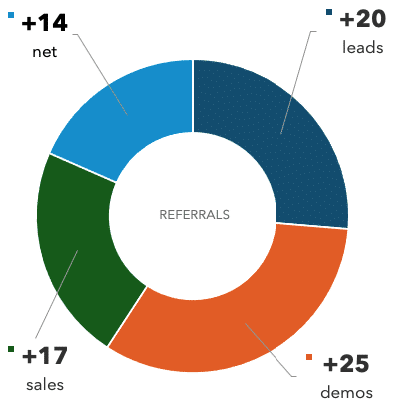
Referral Outbound and Inbound both increased in the 2020-2021 year. Leads increased by 20, demos by 25, sales by 17, and net increased by 14.
Customer Loyalty
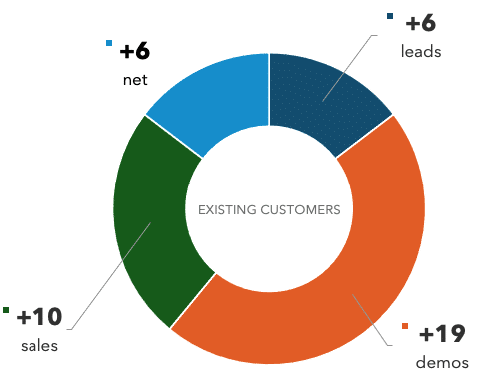
Existing customer projects increased in 2020-2021. Leads increased by 6, demos increased by 19, sales increased by 10, and net increased by 6. There were more leads and more sales from existing customers.
A gain of $113,606.00 was earned as compared to the previous year.
What we did…
Now that we’ve presented the positive results, what are the tasks we performed to achieve results?
The final results.
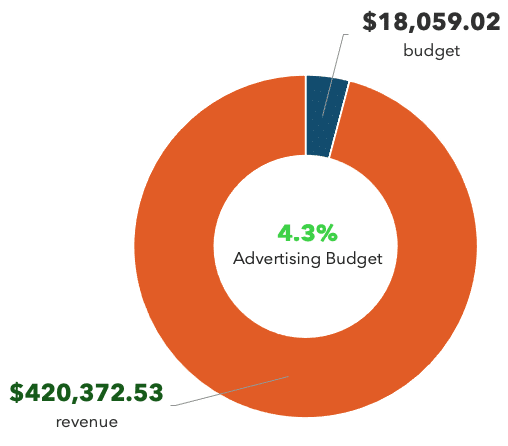
In conclusion, the previous statistics suggest that as both a direct and indirect result of Gaber Marketing’s contributions to the organization, the client earned an annual revenue gain of approximately $420,372.53 with an annual marketing and advertising investment of $18,059.02. That’s a marketing budget of 4.3%.
Thank you for reading this article.
We hope it provided valuable insight into Gaber Client Case Study: Construction Company Marketing
Text “Marketing Help” to 336-422-1994


